Generating Charts
YOSA can generate charts from any data gathered during analyses.
The following basic chart types are supported:
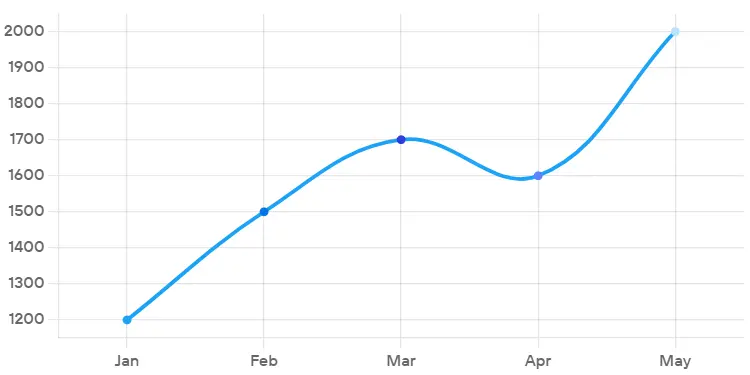
- Line chart
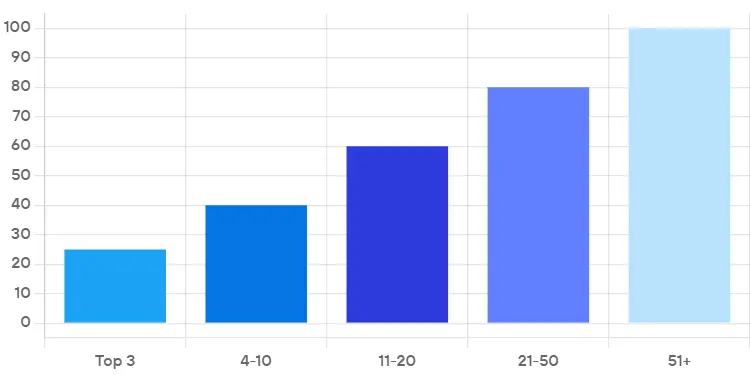
- Bar chart
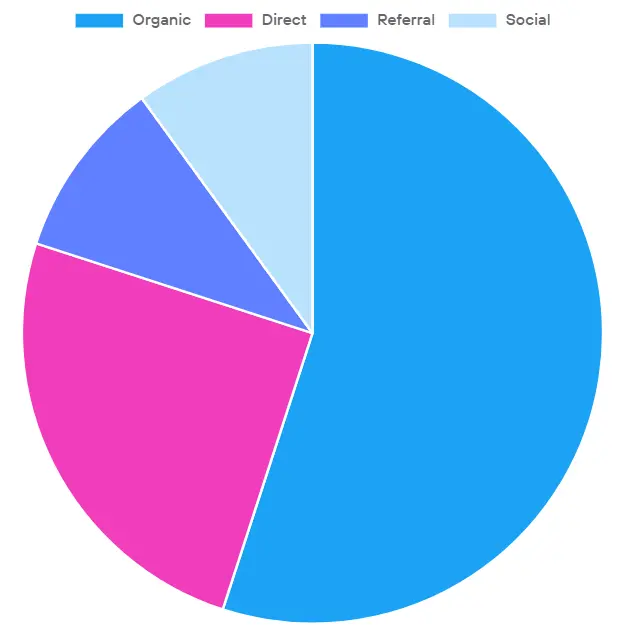
- Pie chart
How to create a chart
To create a chart, just ask YOSA, for example:
- “Check my site’s visibility and present the data in a chart.”
- “Show me how many Google clicks I had in the last 12 months.”
- “Compare my visibility with competitor domains [domain1] [domain2].”
After YOSA provides text-based results, you can also follow up with a command like:
“Show this data in a bar chart.”
…and so on.
Saving charts
Every chart generated in YOSA can be saved as a PNG file with a single click.
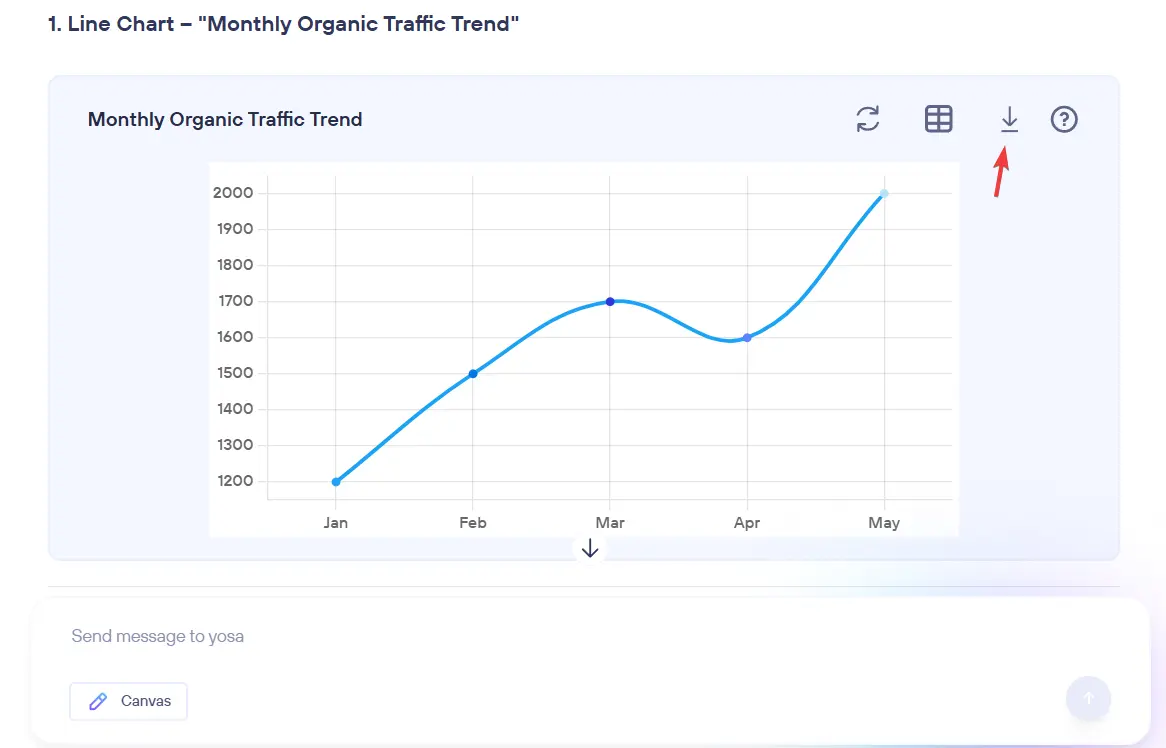
Chart options
You can zoom in and out on any chart by holding CTRL and dragging with the left mouse button to select the area of interest.
To return to the full view, click the refresh button in the chart component.
ℹ️
Currently, charts are not supported inside Canvas. However, you can download them as PNG files and insert them manually into generated text documents.